
Gov Con

Win smarter. Price with confidence.

Practical analysis for government contractors navigating labor markets, indirect costs, competitive pricing, and the decisions that determine whether a bid can win profitably.

From the practitioner behind the platform

Government contracting expertise, built into PTW.

Jon Barker designed PTW around the questions he faced in real capture and pricing work: What does the market support? What are competitors likely to bid? Where is the defensible Price-to-Win point—and can you still perform profitably when you get there?

This page collects Jon's working perspective on those questions, grounded in federal pricing policy, current labor-market evidence, and the economics of actually executing the contract.

Pricing intelligence for modern GovCon.

Latest analysis

View all Gov Con articles →

The Anatomy of a Wrap Rate

You hear the term constantly in GovCon, but understanding the mechanical anatomy of a wrap rate is the difference between winning profitable work and accidentally bidding yourself into a margin-crushing…

You hear the term constantly in GovCon, but understanding the mechanical anatomy of a wrap rate is the difference between winning profitable work and accidentally bidding yourself into a margin-crushing deficit. 

Fundamentally, a cost wrap rate is your indirect cost multiplier. Your total wrap includes profit margin objective. It is the spread between what you pay for an employee’s labor and the fully burdened price you charge the federal government. 

If your base salary or hourly wage is wrong, your wrap rate amplifies that error across the entire life of the contract. The rate is built in four indirect cost pool layers: Fringe, Overhead, G&A, and Profit. Each cost pool stacked on top of the last and begins with the DL. Here is exactly how that math works. 

The Foundation: Direct Labor (DL) 

Let’s say you hire Jen, a Cyber Analyst, at an unburdened rate of $50/hour. This is your baseline. If you are guessing this number, rather than anchoring it to an actual cost or localized Bureau of Labor Statistics (BLS) wage percentiles, every calculation that follows is structurally flawed. 

Layer 1: Fringe Costs (The 40% Example) 

Jen’s $50/hour isn’t your true cost. You must account for legally mandated payroll taxes (FICA, FUTA, SUTA) and discretionary benefits like health insurance, 401(k) matching, and paid leave. 

Benefit costs are highly volatile. Smart pricing teams track macroeconomic indicators like the Employment Cost Index (ECI) to project fringe escalation, rather than guessing. 

Layer 2: Overhead (OH) (The 20% Example) 

Overhead encompasses the direct support Jen needs to execute the contract. This includes her laptop, software licenses, and a prorated share of facility costs (rent and utilities) where she works. 

Layer 3: General & Administrative (G&A) (The 10% Example) 

G&A covers the cost of running the corporate machine. This includes executive salaries, HR, legal, finance, sales, and marketing. A bloated G&A pool is the number one reason legacy primes lose to agile mid-tier contractors. 

Layer 4: Profit / Fee (The 8% Example)

After recovering all direct and indirect costs, you apply your fee. This margin fluctuates based on contract type (Cost-Plus vs. Firm-Fixed-Price), competitive market pressures, complexity of the work, and your strategic Price-to-Win (PTW) targets. 

The Wrap Rate Calculation in Action 

Wrap rates compound multiplicatively, not just additively. Here is how Jen’s $50/hr base transforms into a Fully Burdened Labor Rate (FBLR): 

DL: $50.00 

Fringe (40%): $50.00 × 1.40 = $70.00 

Overhead (20%): $70.00 × 1.20 = $84.00 

G&A (10%): $84.00 × 1.10 = $92.40 

Profit (8%): $92.40 × 1.08 = $99.79 FBLR 

For 1099 subcontractors, you typically strip out Fringe and Overhead, applying only G&A and Profit/Fee to their billed rate. 

These percentages: 40/20/10/8 are illustrative. Actual rates vary widely by contract vehicle, company size, and labor category, which is exactly why a single “industry standard” wrap rate doesn’t really exist. 

The Strategic Takeaway 

Your wrap rate is more than an accounting output; it is a reflection of your corporate efficiency. If your indirects run too high, you cannot win competitive bids. If you artificially compress them to win, you erode your own profit. 

The hard part isn’t building the formula. It’s knowing whether your wrap is actually competitive. Most companies build their rates in isolation, with no visibility into what similar contractors are actually charging for similar work. Winning modern GovCon proposals requires moving away from static spreadsheets and anchoring your rate build-ups in defensible, real-time labor market and peer benchmarking data. When you know your true costs, relative to the market, you know your true competitive advantage.
Your Pricing Model Is Using Data From a Different Economy

Why relying on historical award data is costing contractors wins and how to build a defensible, market-anchored pricing strategy consistent with pricing policy to procure goods and services from responsible…

Why relying on historical award data is costing contractors wins and how to build a defensible, market-anchored pricing strategy consistent with pricing policy to procure goods and services from responsible sources at “fair and reasonable” prices described under FAR 15.402.

When preparing your #govcon proposal, you must understand how they will be evaluated from a pricing perspective and whether there will be adequate competition.  Under proposal analysis techniques described under FAR 15.404-1, Contracting Officers are charged with determining whether a proposal’s pricing is “fair and reasonable” based on the competition, or the next best evaluative techniques starting with historical prices paid.  

Yet across federal procurement, proposal teams keep making the same mistake: treating historical contract prices as gospel. A rate that won five years ago gets copied into this year’s model with a light escalation factor slapped on top and the proposal gets submitted on time.

The problem is that yesterday’s winning rate doesn’t know about this year’s wage inflation, regional labor shifts, or the fact that your top competitor just restructured their fringe pool. When an acquisition file leans heavily on stale award data, it puts both proposal defensibility and contract profitability at risk. Overbid, and you lose on price. Underbid based on rates from a tighter labor market, and you win a contract you can’t staff without burning into your margin.

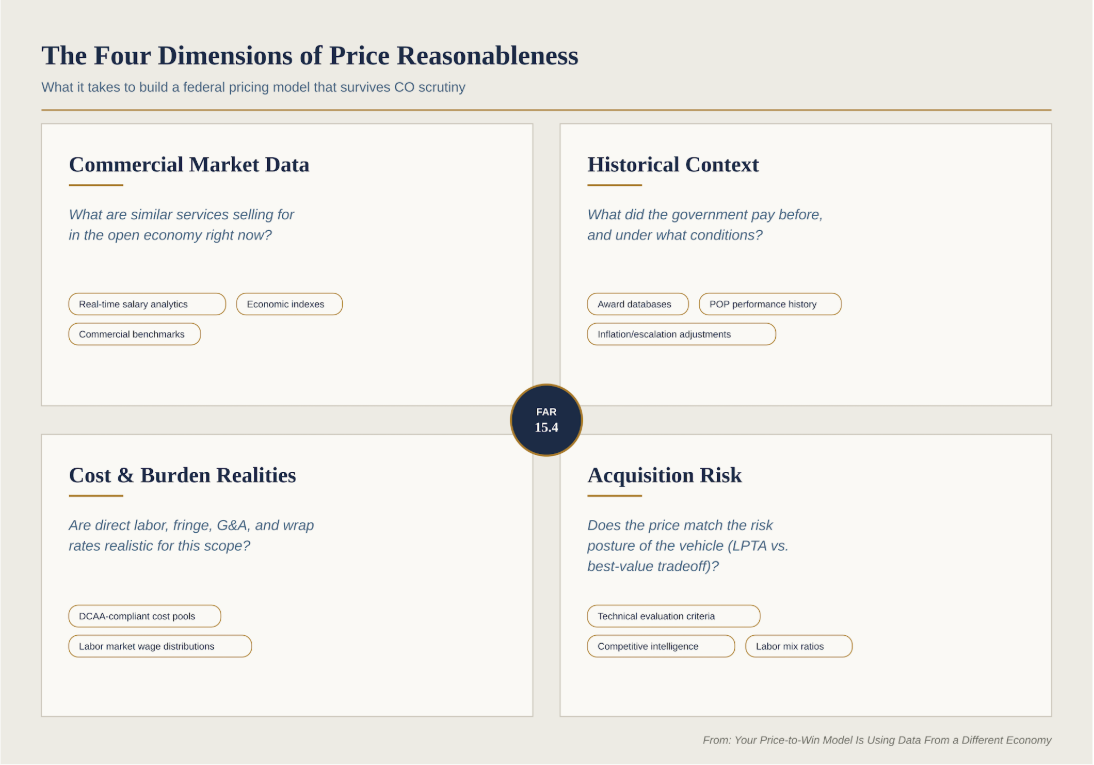
The Four Dimensions of Price Reasonableness

A pricing model that holds up to CO scrutiny — and still protects your margin — has to account for four things at once:

Historical data covers exactly one of these four boxes. Teams that stop there are building three-quarters of a pricing strategy and calling it done.

Turning the Framework Into a Workflow

The four dimensions above are the “what.” Now here’s the *how:” a repeatable workflow capture and pricing teams can run on every bid without reinventing the process each time:

  1. Standardize the labor categories first.

    Before you price anything, map SOW requirements to market-standard occupational codes.
    Translating client LCATs into standardized descriptors—such as BLS OEWS and GSA MAS
    categories—early in capture means comparing apples to apples instead of guessing at
    equivalencies later.

  2. Pull local market data, not a national salary guide.

    A single national average masks wide differences between, for example, Huntsville and
    the National Capital Region. Location-specific, industry-adjusted labor data gets you
    closer to what it actually costs to recruit and retain talent for this contract, in
    this labor market.

  3. Model what your competitors are probably doing.

    Overlay competitive intelligence on rival primes’ likely fringe burdens, overhead,
    general and administrative (G&A) indirect-cost pools, and fee expectations. This
    approximates the pricing against which your proposal will be evaluated and provides a
    crucial input to your probability of win.

  4. Solve for the PTW target point, not just a defensible number.

    The goal is not merely a total price you can justify to a Contracting Officer. It is the
    price ceiling that maximizes probability of win while preserving execution margin. That
    means adjusting senior-to-junior labor ratios, indirect allocations, and fee structure
    until probability of win and profitability intersect—not simply choosing whichever
    number is easiest to defend on paper.

The Bottom Line

Historical pricing data tells you where the market was. Real-time labor market analytics tell you where the market is. Teams that keep running the old workflow aren’t just leaving PWin on the table; they’re building acquisition files that are harder to defend and contracts that are harder to staff at the rates they bid.

Shifting your cost-volume strategy to current market intelligence isn’t an extra step. It’s the step that makes the other three dimensions of price reasonableness actually hold up.

From analysis to action

Build the evidence behind the number.

PTW connects occupational wages, local labor conditions, industry structure, and government-market data so capture and pricing teams can test assumptions before those assumptions become a bid.

See the platform at work

Bring a labor category, target market, or pricing question. We will walk through the evidence together.